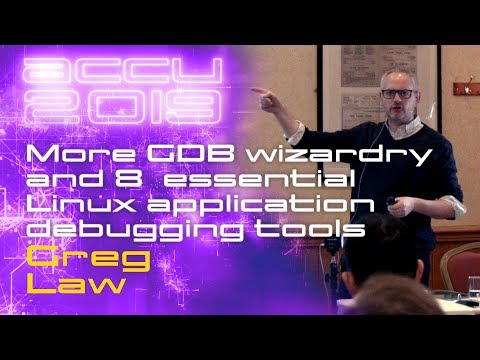
By Greg Law
A practical talk with few slides, and lots of live demos of debugging tools and techniques that will make you a much more effective programmer.
As Kernighan says: everyone knows that debugging is twice as hard as writing a program in the first place. Debugging dominates software development, and is as important as it is overlooked. All too often we rely on printf or at best some basic gdb with not much more than 'breakpoint', 'continue', 'next' and 'print'.
This talk will demonstrate some of the power of newer versions of GDB (Reverse debug, dynamic printf, amazing scriptability with Python), as well as some of the other Linux debugging tools at your disposal: ftrace, strace, ltrace, valgrind, rr, asan, perf, and others.
The presentation works either as a stand-alone talk or as a follow on to Greg’s popular 'GDB Power User' talk at ACCU 2017.


