Covid-19 data is available in many places. Donald Hernik demonstrates how to wrangle data out of the UK API.
WARNING: This article is written in an unnecessarily cheerful tone (“Ah! So you’re a waffle man!” [Red Dwarf]) as an antidote to the subject matter and the current state of the world. Stay safe, everybody.
Please note: This article was written in October 2020 and the Developers’ Guide document referenced below has been updated many times since.
Introduction
I don’t think I’ve seen so many charts in the press since the happy days of the Brexit referendum or, perhaps, the Credit Crunch. Say what you like about Coronavirus but if you like charts then this is a fantastic time to be alive...
I am not a data scientist but I wondered – could I get the underlying data and plot my own charts?
Good news, yes! But there were some problems along the way.
Public Health England (PHE) Data
Public Health England publish the UK Covid data and sites exist to view the various charts [GOV.UK-1].
The data are also published via an endpoint:https://api.coronavirus.data.gov.uk/v1/data
- There is a Developers’ Guide [GOV.UK-2] (henceforth referred to as DG) for consuming this. The DG tells you how to structure requests, what metrics are supported, error codes, etc.
- The list of metrics that can be requested is (as documented in the DG) regularly updated so there may be more metrics to request next week than this.
- Separately there is a wrapper SDK (uk-covid19) which simplifies using the endpoint. There is separate documentation for this [PHE] but reading the DG is still very useful.
The uk-covid19 SDK API
In summary:
- The SDK is provided for Python, JavaScript, and R.
- Requests are input as JSON.
- Response data can be extracted as JSON or XML.
- Without the SDK, requests can be made directly to the endpoint above via e.g. the Python HTTP requests. The SDK libraries wrapper useful behaviour such as processing multiple ‘pages’ of data in the response. It also swallows some error cases – see below.
The Python implementation
I am not a Python developer (see also ‘data scientist’, above) having only really used it for build scripts and log scrapers but this was an interesting opportunity to learn something new, and Python has a well-earned reputation for developing things quickly and simply.
The Python SDK requires Python 3.7+ so I installed Anaconda 3.8. The SDK module is installed via PIP.
pip install uk-covid19
Making requests
Please note that (through nobody’s fault) the formatting of the listings has suffered slightly for publication. You’ll just have to trust me that it’s valid Python.
WITHOUT using the API
Making a request without using the API is simple enough – see Listing 1 – however:
NOTE1: Quiz – does the get method get all of the pages of the response? The API requests multiple pages in a loop until the response is HTTPStatus.NO_CONTENT...
NOTE2: We can handle all the HTTP status codes, especially 204 (Success – no data).
import requests

def main():
  """Get the Covid data via the endpoint"""
  try:
    area_name = 'suffolk'
    area_type = 'utla'
    url = 'https://api.coronavirus.data.gov.uk/v1/data?'
    filters = f'filters=areaType={area_type};areaName={area_name}&'
    struc = 'structure={"date":"date",
    "newAdmissions":"newAdmissions",
    "cumAdmissions":"cumAdmissions",
    "newCasesByPublishDate":
      "newCasesByPublishDate:}'
    endpoint = url + filters + struc
    # NOTE 1: Does this get all of the data?
    # Or just the first page?
    response = requests.get(endpoint, 30)
    if response.status_code == 200:
      # OK
      data = response.json()
      print(data)
    else:
      if 204 == response.status_code:
        # NOTE 2: This explicitly warns if no
        # data is returned.
        print(f'WARNING: url [{url}], status_code
        [{response.status_code}], response
        [Success - no data]')
      else:
        print(f'ERROR: url [{url}], status_code
        [{response.status_code}], response
        [{response.text}]')
    except Exception as ex: # pylint:
    disable=broad-except
      print(f'Exception [{ex}]')
if __name__ == "__main__":
  main()
|
| Listing 1 |
WITH the uk-covid19 API
Making a request using the API is simple enough – see Listing 2 – however:
NOTE3: Can we detect that a 204 (Success – no data) response happened? No. The API throws an exception only for HTTP error codes >= 400.
from uk_covid19 import Cov19API
def main():
  """Get the Covid data via the API"""
  try:
    area_name = 'suffolk'
    area_type = 'utla'

    # The location for which we want data.
    location_filter = [f'areaType={area_type}',
    f'areaName={area_name}']

    # The metric(s) to request. NOTE: More than in
    # the previous example, for variety.
    req_structure = {
    "date": "date",
    "areaCode": "areaCode",
    "newCasesByPublishDate":
"newCasesByPublishDate",
    "newCasesBySpecimenDate":
"newCasesBySpecimenDate",
    "newDeaths28DaysByDeathDate":
"newDeaths28DaysByDeathDate",
    "newDeaths28DaysByPublishDate":
"newDeaths28DaysByPublishDate"
    }

    # Request the data.
    # This gets all pages and we don't need to care how.
    api = Cov19API(filters=location_filter, structure=req_structure)
    # Get the data.
    # NOTE3: If a 204 (Success - no data) occurs can we tell?
    data = api.get_json()
    print(data)
  except Exception as ex: # pylint: disable=broad-except
    print(f'Exception [{ex}]')
if __name__ == "__main__":
  main()
|
| Listing 2 |
API Pitfalls
Some problems that I encountered along the way.
The 204 response
As documented in the DG, HTTP response 204 is ‘Success – no data’ and the response JSON looks like this.
{'data': [], 'lastUpdate': '2020-10-30T15:31:25.0 00000Z', 'length': 0, 'totalPages': 0}
Unfortunately, via the API, you can’t tell what the HTTP status code was (unless it’s >= 400, in which case an exception is thrown).
Where is my data (part 1)?
Surely there is data for ‘Englund’? Why is my response empty?
If you e.g. misspell an areaName then the server responds with a "204 OK" response. The API swallows the status code so we can’t tell if there is genuinely no data or a typo in our request.
This is why we, as good programmers, always validate our input.
Where is my data (part 2)?
There are multiple areaType values (briefly documented in the DG). I’ve never worked in healthcare or the public sector (see also ‘Python developer’ and ‘data scientist’, above) so some of these are new to me. The non-obvious areaType values are:
nhsRegion– how and why is this different toregion(e.g. ‘Yorkshire and the Humber’)?What are the valid values? I haven’t had time to find out as I stuck to obvious
areaTypes –nationetc.utlavltla– Upper Tier v Lower Tier Local Authorities.Some values e.g. ‘Leeds’ are both a UTLA and an LTLA, and some are not.
Suffolk (UTLA) for example is composed of ‘Babergh’, ‘Ipswich’, ‘South Suffolk’, ‘Mid Suffolk’, and ‘West Suffolk’ (each an LTLA).
If you mismatch a valid areaName and a valid areaType in your request then you can get a 204. For example: e.g.
| areaName | areaType | HTTP response status |
|---|---|---|
| Leeds | ltla | 200 – OK |
| Leeds | utla | 200 – OK |
| Suffolk | ltla | 204 – OK // No data |
| Suffolk | utla | 200 – OK |
This makes sense, but more input validation required.
Where is my data (part 3)?
Occasionally, especially while coding on Saturdays, I encountered error code 500 ‘An internal error occurred whilst processing your request, please try again’ responses even for my perfectly crafted requests.
I tried again later – there was data.
Where is my data (part 4)?
As documented in the About the data guide [GOV.UK-3] there are sensible caveats about data correctness and availability.
- Sometimes data is simply not available for all areas for a given date. It is common (and by design) that for some requested metrics the response value is
None(data missing) which is different to a response value of zero (data present, and zero). - Sometimes data is retrospectively corrected/added so be careful if you’re going to e.g. cache it by date. Data that is not there today for day T-n might one day be added (or might not).
- The broader the
areaType(e.g.nation) the more metrics are populated.For example,
hospitalCases,covidOccupiedMVBeds,maleCases, andfemaleCasesare populated for England (on dates that values are available) but are never (to date) populated at the LTLA or UTLA level. - The only data consistently populated to date for UTLA and LTLA
areaTypes are various cases and death metrics (newCases…,newDeaths…,cumDeaths…, etc). This may change in the future. - For cumulative metrics (e.g. cumAdmissions) the value is only populated on dates it changes e.g. on date T
cumAdmissionsmay be 9999 and on date T+1 it may beNone.
If you inspect the response JSON as you develop, you will spot this and anticipate None values.
Processing the data
Data
Once your request is perfected, you’ll get some nice, shiny, data. This example is from areaType=nation, areaName=England. Only one date is shown here but there are multiple dates in the JSON and data back to 2020-01-03. See Listing 3.
{
  "date": "2020-10-29",
  "hospitalCases": 8681,
  "newAdmissions": null,
  "cumAdmissions": null,
  "covidOccupiedMVBeds": 803,
  "newCasesByPublishDate": 19740,
  "newCasesBySpecimenDate": 726,
  "cumDeaths28DaysByDeathDate": 40854,
  "newDeaths28DaysByDeathDate": 61,
  "cumDeaths28DaysByPublishDate": 40628,
  "newDeaths28DaysByPublishDate": 214
}
|
| Listing 3 |
NOTE: The null values are a side effect of saving the data to file. In the Python app they are None.
Plotting a chart
This article would be too long (“So you’re a waffle man!”) if I delved into plotting charts. Suffice to say that I had a poke around on Stackoverflow [Stackoverflow] and discovered matplotlib [Matplotlib]. One tutorial later (I don’t remember which – sorry) and I churned out a chart of my own. There was much rejoicing. Sadly, the chart showed that hospital admissions and mechanical ventilated bed occupancy were increasing, so the rejoicing was reined in somewhat.
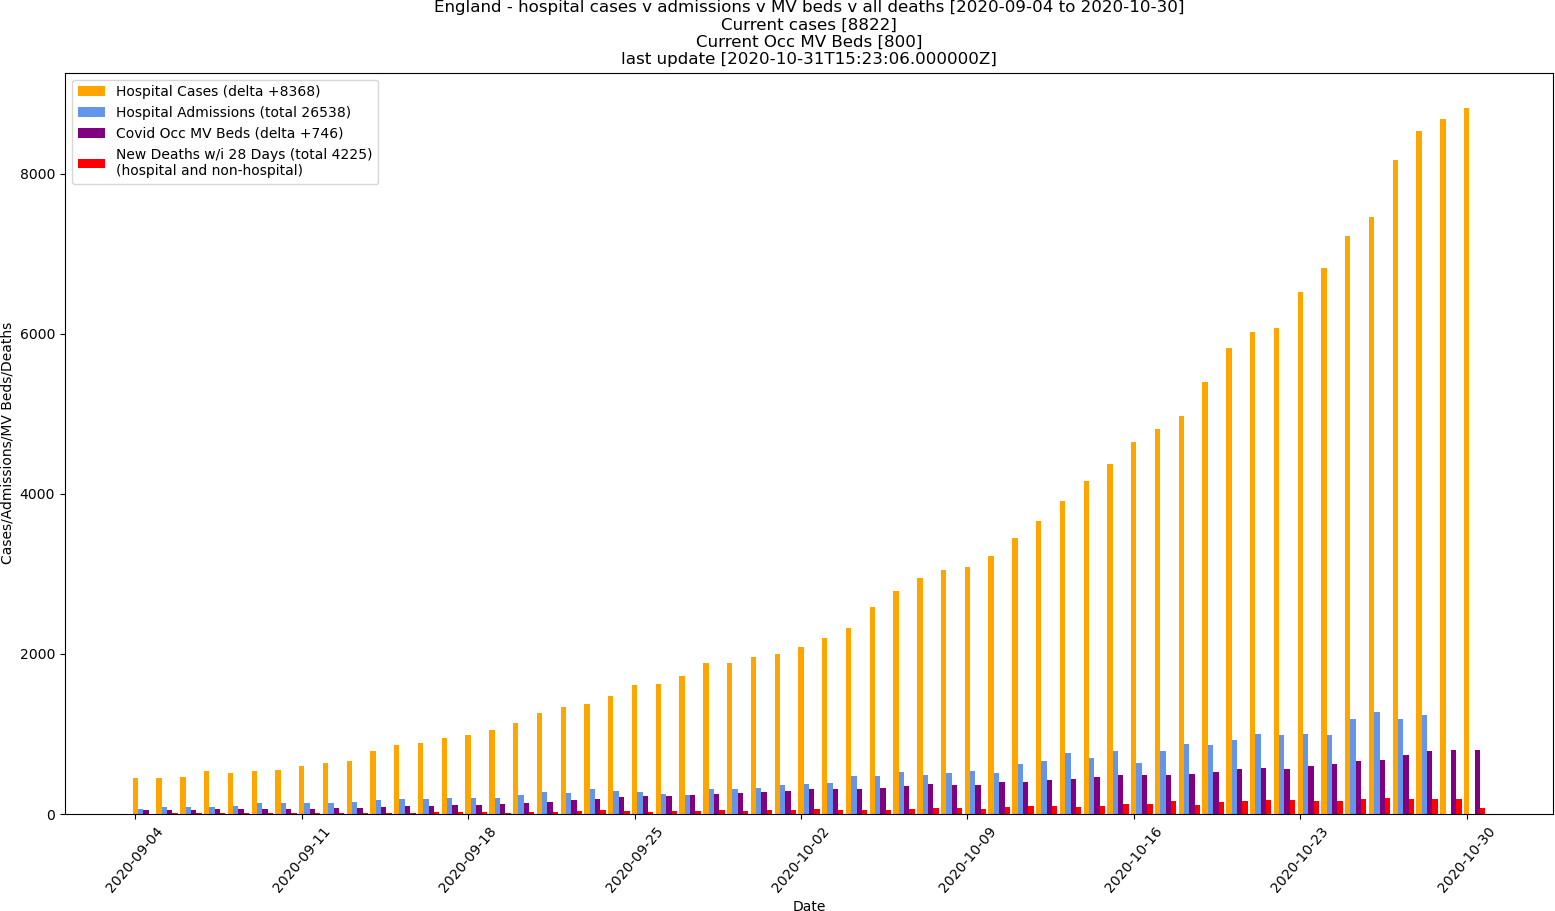 |
| Figure 1 |
Conclusion
- The uk-covid19 SDK is easy to use and the data can be used to plot your own charts – mission accomplished!
- The data comes with documented caveats to which you should pay close attention.
- Not all metrics are available for all
areaTypes. - Watch out for HTTP code 204 and other pitfalls.
References
[GOV.UK-1] Daily Summary: https://coronavirus-staging.data.gov.uk/
[GOV.UK-2] Developers’ Guide: https://coronavirus.data.gov.uk/developers-guide
[GOV.UK-3] About the Data: https://coronavirus.data.gov.uk/about-data
[Matplotlib] https://matplotlib.org/3.1.1/index.html
[Red Dwarf] Talkie Toaster: https://reddwarf.fandom.com/wiki/Talkie_Toaster
[PHE] Python SDK Guide: https://publichealthengland.github.io/coronavirus-dashboardapi-python-sdk/pages/getting_started.html#
[Stackoverflow] Stackoverflow: https://stackoverflow.com/
has a BSc in Information Systems and has been a software developer for over twenty years, predominantly using C++, and most recently in Financial Services. He is currently looking for an interesting, fully remote, job.