How do you measure throughput? Richard Reich and Wesley Maness investigate suitable metrics.
In our previous article [ Maness18 ] we collected measurements of latency which was later used in our analysis of the impact of cache-line aware data structures. In this paper, which can be thought of as a follow-up to our previous paper, we instead focus on throughput as a quantifiable metric. We will also be using newer hardware and the Centos 7.2 tool chain with a custom gcc 7.1. We will refer to some code examples, not shown here, that may require the reader to reference the code in the previous article, but we will attempt to minimize the need to reference, focusing as we investigate many ways to measure throughput and their observed behavioral changes. These changes will be measured in multiple ways to demonstrate the different aspects of throughput detailed below. We will also follow the same approach, which is to say we will first introduce our definitions, then take measurements, introduce aligned data structures (the same queue as before), and measure those observations. Keeping things simple for now so we can pin down the observations and the impact of cache-line aware data structures.
Before we get into the analysis of throughput, why does it matter? What does throughput tell us and what are the various scenarios in which we require a firm understanding of throughput and its implications? Throughput simply tells us how much work/data we can send or distribute given some constraints such as a network cable, pipe, or wireless signal. If we have an idea of how much work or data we can send to one location to another, we can have a better understanding of the upper limits of our network.
If we can postulate some upper bound limits of our throughput, we can better model how much work can be performed, given the flow of input into our received end points. Once we have a theoretical ceiling of the received data, we can then start to see where these questions become quite interesting in many domains. For example, within a defined time window: how many frames per second can we render on screen, how many updates can we compute, how much market data can we distribute, how many orders can we route to an algorithm or broker, how many messages can we send out to subscribers. These examples all require some basic understanding of throughput, how to measure it, and implications on data load.
Taking it one step further, once a firm understanding of the expected throughput is established the new insights will lend to more effective design, or even deployment of various components in a technical domain. If this is abstracted even further – we can start to explore networks and control flow problems using throughput as a weight on each node in a graph, thinking of routing traffic in real time, and other interesting areas to explore, but not here.
Definitions
For us to have some way of comparing results we need to provide clear definitions of throughput and discuss some issues surrounding measurement taking.
We offer two types of throughput for our analysis. The first one can be thought of as the classical definition of throughput. This is simply a measure of data of some period. The data can be structured in any form and we can slice and dice the time to any unit we deem necessary. Going forward in the paper we refer to this point of observation and or operations over time as spatial throughput(ST). Often the analogy that comes to mind for ST is network bandwidth. Our formal definition for ST will be defined as the number of work units (WU) over time t . We will measure a single WU as the number of cycles observed in the TSC register. All the code found for measuring ST is shown in Listing 1.
// one billion is once per second
// works_ is the number of work units
//   executed this observation period.
uint32_t bandwidth(uint32_t per = 1'000'000'000)
{
    // CPU is CPU speed in GHz
    // per is observation time scale units
    // end_ - start_ is the observation window.
    return (static_cast<float>((works_)*CPU*per) /
  (end_ - start_));
}
|
| Listing 1 |
Note: to scale to a time quantum, divide ST by the desired time quantum and multiply by the CPU clock speed.
A second type of throughput we intend to observe in the paper is how much work can we do given new work to be done. This can be thought of as temporal throughput (TT). Often this is another way of looking at how frequently I am polling versus how frequently I am pulling data and processing that data. This can be thought of as saturation and often quoted as a percentage.
We will measure TT as two distinct types of value. TT ratio (TTR) will be defined as the number of WU divided by poll count and quoted as a percentage. A value of 1 would be full saturation. All the code found for measuring TTR is shown in Listing 2.
// polls_ is the amount of time taken to poll for work
uint16_t saturationRatio()
{
    if (polls_)
        return static_cast<uint16_t>(
(static_cast<float>(works_) / polls_));
    else
        return 0;
}
|
| Listing 2 |
The second type of TT we will measure will be TT cycles (TTC). TTC will be defined as the total time of work divided by the total time of work plus the overhead. All the code found for measuring TTC is shown in Listing 3.
// saturation_ is number of cycles spent working
// overhead_ is number of cycles spent polling
// for work
uint16_t saturationCycles()
{
    if (saturation_)
        return static_cast<uint16_t>(
          (static_cast<float>(saturation_) / (saturation_
          + overhead_)));
    else
        return 0;
}
|
| Listing 3 |
There are some observational complexities that surround TT data gathering especially compared to ST. In the TT case, we should really focus on using RDTSC as an instruction and not RDTSCP, as RDTSCP basically creates a code fence and can in many ways hamper or prevent hardware optimizations such as out of order execution and execution pipelining that would affect our cycles count. Due to the aggregate nature of measuring many WU in a particular time window the inaccuracies of RDTSC do not affect our measurements in a significant way. In our previous paper each WU was measured and recorded, necessary for the purpose of statistical analysis. When many WU are recorded as an aggregate quantification the inaccuracies are tiny compared to the impact of the serialized RDTSCP instruction.
Setup
ST setup
In our first experiment, we will focus only on measuring ST with and without cache-line awareness scaling from 1, 4, 8, and 16 threads, each thread will be pinned to a different core and producing work which will be in the simplified form of a 4-byte atomic increment. Shown on the right is the section of code (Listing 4) that performs this first setup.
template <int X>
struct DataTest
{
  alignas (X) std::atomic<uint32_t> d{0};
};

void CLTest ( std::atomic<uint32_t>& d )
{
  for (;;)
  {
    ++d;
  }
}

template <int Align>
int simpleTest (const std::string& pc)
{
  using DataType_t = DataTest<Align>;
  DataType_t data[128];
  std::vector<std::unique_ptr<std::thread>>
    threads;
  threads.reserve(pc.length());

  int32_t core{0};
  int32_t idx{0};
  for(auto i : pc)
  {
      if (i == 'p')
      {
          threads.push_back(std::make_unique<std::thread>
            (CLTest, std::ref(data[idx].d)));
          setAffinity(*threads.rbegin(), core);
          ++idx;
      }
      ++core;
  }

  auto counters = std::make_unique<uint32_t[]>(idx);

  for (;;)
  {
    sleep(1);
    int32_t i{0};
    for (i = 0; i < idx; ++i)
    {
       counters[i] = data[i].d.load();
       data[i].d.store(0);
    }


      uint64_t total{0};
      for (int i = 0; i < idx; ++i)
      {
        std::cout << "d" << i << " = " <<
          counters[i] << ", ";
        total+= counters[i];
      }
      std::cout << ", total = " << total
        << ", avg = " << static_cast<float>
        (total) / idx << std::endl;
      total = 0;
  }
  return 0;
}
|
| Listing 4 |
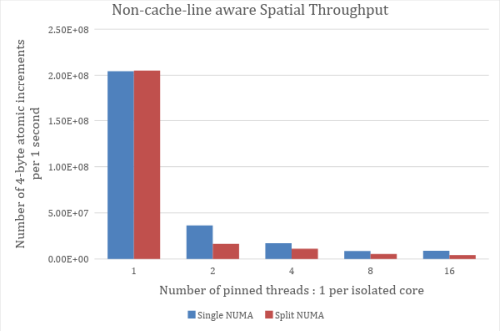
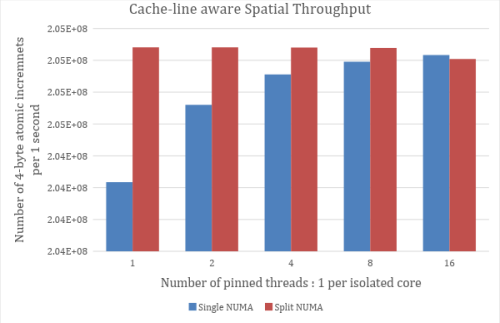
In Figure 1, we have captured average ST numbers for incrementing a single 4-byte atomic
int
. In those tests, we use thread numberings from 1 to 16 in powers of 2. In the split NUMA the threads are evenly distributed across two NUMA nodes. Each thread is pinned to a single core and no more than one thread per core.
|
|
| Figure 1 |
TTR, TTC, and ST Setup
In our second experiment, we will measure TTR, TTC and ST. We will focus on non-cache-line awareness and cache-line awareness for various combinations of producers and consumers. The code we present below is in the same order in which they would be executed at the functional level. The first is the
simpleTest
method driven from main shown in Listing 5. The second unit of execution is the run method shown in Listing 6. Heavily utilized during the run method is our consumer method shown in Listing 7.
template <int Align>
int simpleTest (const std::string& pc)
{
  using DataType_t = DataTest<Align>;
  DataType_t data[128];

  std::cout << "Sizeof data = " << sizeof(data)
            << std::endl;

  std::vector<std::unique_ptr<std::thread>>
    threads;

  threads.reserve(pc.length());

  int32_t core{0};
  int32_t idx{0};
  for(auto i : pc)
  {
    if (i == 'p')
    {
      threads.push_back(std::make_unique
          <std::thread>(CLTest,
            std::ref(data[idx].d)));

      setAffinity(*threads.rbegin(), core);
      ++idx;
    }
    ++core;
  }

  auto counters =
    std::make_unique<uint32_t[]>(idx);

  for (;;)
  {
    sleep(1);
    int32_t i{0};
    for (i = 0; i < idx; ++i)
    {
      counters[i] = data[i].d.load();
      data[i].d.store(0);
    }

    uint64_t total{0};
    for (int i = 0; i < idx; ++i)
    {
      std::cout << "d" << i << " = "
                << counters[i] << ", ";
      total+= counters[i];
    }
    std::cout << ", total = " << total
              << ", avg = "
              << static_cast<float>(total) /
                    idx
              << std::endl;
    total = 0;
  }
  return 0;
}
|
| Listing 5 |
template<typename T,template<class...>typename Q>
void run ( const std::string& pc, uint64_t workCycles, uint32_t workIterations )
{
  using WD_t = WorkData<alignof(T)>;
  // shared data amongst producers
  WD_t wd;

  std::cout	<< "Alignment of T "
    << alignof(T)
    << std::endl;

  std::cout   << "Size of CycleTracker "
    << sizeof(CycleTracker)
    << std::endl;

  std::cout   << "Size of ResultsSync "
    << sizeof(ResultsSync)
    << std::endl;

  std::vector<std::unique_ptr<std::thread>>
    threads;

  threads.reserve(pc.length());
  // reserve enough of each for total number
  // possible threads
  // They will be packed together causing false
  // sharing unless aligned to the cache-line.
  auto rs =
    std::make_unique<Alignment<ResultsSync,
      alignof(T)>[]>(pc.length());
  auto ct =
      std::make_unique<Alignment<CycleTracker,
      alignof(T)>[]>(pc.length());

  Q<T> q(128);

  // need to make this a command line option
  // and do proper balancing between
  // consumers and producers
  uint32_t iterations = 1000000000;

  uint32_t core{0};
  uint32_t index{0};
  for (auto i : pc)
  {
    if (i == 'p')
    {
      threads.push_back(
          std::make_unique<std::thread>
          (producer<T,Q<T>>
           , &q
           , iterations
           , workCycles
           , workIterations));
      setAffinity(*threads.rbegin(), core);
    }
    else if (i == 'c')
    {
      threads.push_back(
          std::make_unique<std::thread>
          (consumer<T,Q<T>,WD_t>
           , &q
           , iterations
           , std::ref(rs[index].get())
           , std::ref(ct[index].get())
           , std::ref(wd)));
      ++index;
      // adjust for physical cpu/core layout
      setAffinity(*threads.rbegin(), core);
    }
    else if (i == 'w')
    {
      threads.push_back(
          std::make_unique<std::thread>
          (worker<WD_t>,
           std::ref(wd)));

      // adjust for physical cpu/core layout
      setAffinity(*threads.rbegin(), core);
    }

    ++core;
  }

  Thread::g_cstart.store(true);
  usleep(500000);
  Thread::g_pstart.store(true);

  auto results =
    std::make_unique<Results[]>(index);

  for (;;)
  {
    sleep(1);
    for ( uint32_t i = 0; i < index; ++i)
      results[i] =
        ct[i].get().getResults(rs[i].get(), true);

    uint64_t totalBandwidth{0};
    std::cout << "----" << std::endl;
    std::cout << "workCycles = " << workCycles
              << std::endl;
    std::cout << "workIterations = "
              << workIterations
              << std::endl;

    for ( uint32_t i = 0; i < index; ++i)
    {
      // T1 Begin
      std::cout << "Temporal: saturation [Cycles]"
        "= " << results[i].saturationCycles()
        << std::endl;
      std::cout << "Temporal: saturation [Ratio]"
        " =  " << results[i].saturationRatio()
        << std::endl;
      std::cout << "Spatial: Bandwidth [work/sec]"
        " = " << results[i].bandwidth()
        << std::endl;
      totalBandwidth += results[i].bandwidth();
      // T1 End
    }
    std::cout << "Total Bandwidth = "
              << totalBandwidth << std::endl;
    std::cout << "----\n" << std::endl;
  }

  for (auto& i : threads)
  {
    i->join();
  }
}
|
| Listing 6 |
template <typename T, typename Q, typename WD>
void consumer(Q* q, int32_t iterations,
    ResultsSync& rs, CycleTracker& ct, WD& wd)
{
  while (Thread::g_cstart.load() == false) {}

  T d;
  uint64_t start;
  bool work = false;

  ct.start();
  for (;;)
  {

    CycleTracker::CheckPoint cp(ct, rs);
    // roll into CheckPoint constructor?
    cp.markOne();

    start = getcc_ns();
    work = q->pop(d);
    if (!work)
    {
      cp.markTwo();
      __builtin_ia32_pause();
      continue;
    }
    cp.markTwo();

    // simulate work:
    // When cache aligned WD occupies 2
    // cache lines
    // removing the false sharing from the read
    for (uint32_t k = 0;
        k < d.get().workIterations; k++)
    {
      // get a local copy of data
      WD local_wd(wd);
      // simulate work on data
      while (getcc_ns() - start <
          d.get().workCycles){}

      for (uint32_t it = 0;
          it < WriteWorkData::Elem; ++it)
      {
        // simulate writing results
        // This is false sharing, which
        // cannot be avoided at times
        // The intent is to show the separation of
        // the read and write data
        wd.wwd.data[it]++;
      }
    }
    cp.markThree();
  }
}
|
| Listing 7 |
Other code was deliberately left out but for anyone interested please contact the authors and we can provide access to a complete package. After everything has run and executed we have collected our results into two tables. Table 1 is a simple bandwidth analysis of the Boost MPMC queue for cache-line awareness and non-cache-line awareness. Table 2 is where we provide a simulated work load of 3000 cycles and 10 iterations per cycle.
|
||||||||||||
| Table 1 |
|
||||||||||||
| Table 2 |
We intentionally introduced false sharing into the simulated work as there are many cases, in a production system, where this is unavoidable. Without false sharing, the results would have shown much more sensational numbers but, in our opinion, would have misrepresented a significant amount of real world application. In the event a system is fortunate enough to eliminate all false sharing, a greater boost in performance will be realized due to cache-line awareness. If the reader is curious, they can obtain a copy of the code and experiment by removing the false sharing in the consumer thread.
Analysis
The results of the bandwidth test are shown in Table 1. Here we can see the approximate savings/gains moving from a non-cache-line aware to cache-line aware queue are around 2.48% for TTC, 10.29% TTR, and 3.76% ST respectively. The results of the simulated workload are shown in Table 2. The approximate savings/gains from non-cache-line aware to cache-line aware are around 7.52% for TTC, 0% for TTR, and 123.86% ST respectively. The largest overall improvement we noticed was when workload decreased the savings for ST improved the greatest when adjusting for cache-line awareness. [the more work load there is per WU, i.e. more cycles, the less of an impact cache line alignment has on throughput.] The other measurements of TTC and TTR generally had overall improvements but the savings or gains in this case were not as great as they were for ST.
Conclusion and future direction
Based on our limited observations, we can clearly see that the gains achieved for cache-line awareness in our queues were greatest for ST data points under simulated workload. This suggests that there could be some interesting relationships between workload scaling and ST for cache-line aware MPMC queues. These relationships could be explored further to attempt to understand the savings gained given the workload and attempt to better identify potential bottlenecks in the utilized MPMC queue.
Notes
GCC 7.1 was used with the flags -std+c++17 -Wall -O3. Boost 1.64 was used on a dual socket 18 core (36 total) Intel (R) Gold 6154 CPU @ 3GHZ. Hyper-threading was not enabled. CPU isolation is in place. Special thanks to Frances Buontempo for her early feedback and suggestions for improvement. Complete source code packages utilized in this article can be made available by contacting the authors directly.
References
[Mannes18] Wesley Maness and Richard Reich (2018) ‘Cache-Line Aware Data Structures’ in Overload 146, published August 2018, available online at: https://accu.org/index.php/journals/2535
Wesley Maness has been programming C++ for over 15 years, beginning with missile defense in Washington, D.C. and most recently for various hedge funds in New York City. He has been a member of the C++ Standards Committee and SG14 since 2015. He enjoys golf, table tennis, and writing in his spare time.