The C++ Standard is often silent on what happens when things go wrong. Matthew Jones looks under the bonnet to take control.
This article explores some of the the grey areas between the C++ language, the OS and the CPU. All three come into play when memory problems arise, and usually in the form of the dreaded undefined behaviour (UB).
A lot goes on behind the scenes between a system booting, or an application starting in its fresh virtual memory space, and main() being called. Most people are happy to gloss over, or even ignore, this area. This is acceptable because it works perfectly almost all the time. Usually we only care that main() is called (somehow), memory is allocated when you ask for it (somehow), and everything works just fine. But what happens when things go wrong and the system starts to behave incorrectly? Will we even notice? Will it lead to a crash? How do we go about debugging these problems? Is it even feasible to debug dynamically, or do we give up and start inspecting the source code? We might, and in simple single threaded code this could be sufficient. But if we put some effort into taming, or even defining, our undefined behaviour, we can tell far more from a crash than we might think. With a bit of preparation, we can make UB work for us, rather than baffle us.
The details here are highly system specific, but so are crashes. Every architecture and application is different, but the principles should be widely applicable. Some techniques involve dipping into the C run time initialisation code, and will only be possible in the more embedded (i.e. roll your own) environments. We focus on C++, and some of its peculiar memory problems, but some of the techniques could apply to many other languages. YMWCV (Your Mileage Will Certainly Vary)!
Some of you might notice that a number of the tricks here are based on the Microsoft SDK C run time debug, in particular the memory debug and filling on initialisation [ MSDN1 ]. Even if you are already using that it is useful to understand the details of how and why it works.
Program behaviour
The result of what we do as programmers is mostly defined and specified: we write source code according to a standard [ C++ ], that a compiler converts into object code. The behaviour of that code is well defined and should hold no surprises.
There are a number of other kinds of behaviour, presented here in order of increasing 'danger' to the programmer.
Implementation defined behaviour
Standardised behaviour is not possible because of a dependency on the underlying platform. Word size, alignment and endianness are common cases. Given a known platform or architecture, however, behaviour is defined.
Unspecified behaviour
Behaviour that is not specified by the standard, but it is still good behaviour. The standard can not make guesses about, or rely on, such behaviour because it depends on the system context. Examples are program performance; storage of data in memory (padding, ordering etc., but not alignment); or the exact instructions a compiler might generate for a given line of code. The actual behaviour can often be changed, for example by altering compiler settings. Even if we do not have control over this kind of behaviour we can at least discover what it is.
Undefined behaviour
When program behaviour depends on factors entirely beyond the control of the language specification, there is no way it can state what should happen outside 'normal' behaviour: it has to be left undefined by the language. For example some hardware will trap certain types of illegal memory access, but other hardware doesn't.
Undefined behaviour is traditionally, and rightly, the most feared kind. But fear usually stems from lack of knowledge or understanding, and we certainly can address these two deficiencies.
It was pointed out on ACCU-General recently [ Henney ] that on any particular system, with a particular context, UB is repeatable :
With respect to the C and C++ standards, the use of certain constructs can be considered to result in undefined behaviour
When we know the system, and can see the assembly code generated by the compiler, we do know what will happen, even though the results are probably undesirable. So for a known context (the application we are developing, with our particular compiler, on one particular system) our UB usually becomes known, repeatable behaviour. There is still scope for other factors to influence predictability (e.g. multithreading), but in principle we can still attempt to understand and therefore control it.
The side effects of UB can often go unnoticed. Silent failures are very dangerous because the defect leading to the UB has therefore escaped test and will be released from development. It is often the case that a later change to the software or system then changes the context of the defect: the symptoms change for the worse and the failure is no longer silent. One of our objectives should be to ensure that UB fails fast [ Fowler ].
Because of the lack of definition, there is potential for us to step in and not only define the behaviour, but to ensure it is something that suits us. Since UB usually stems from incorrect program operation, any definition we impose should deal with, or be tolerant of, that incorrect operation. We have seen that UB is actually predictable and repeatable: if we choose to define an area of UB, it becomes user defined , repeatable behaviour triggered by incorrect operation: we can make it provide useful debug information, and turn it to our advantage. I hope to show that is feasible to replace UB with defensive measures that are sufficient to automatically diagnose most memory problems.
Background
I am assuming a fair degree of familiarity with how CPUs work, how memory is allocated, how the compiler represents objects, and so on. Before exploring the details, this section contains definitions and summaries of the most relevant terms. Most terms used here are explained in depth by Wikipedia [ Wikipedia1 ].
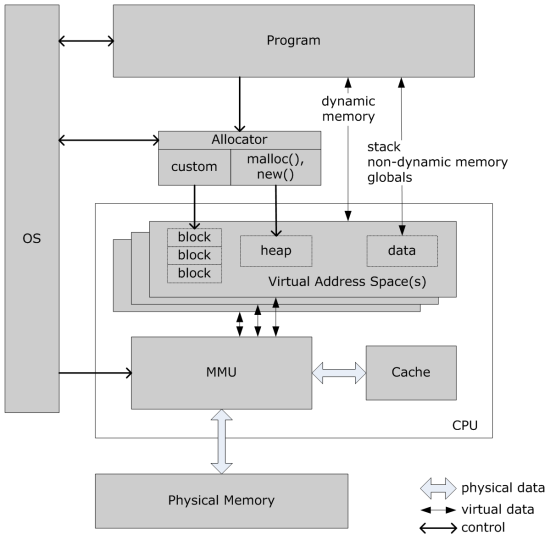
Figure 1 shows the memory features of a generalised system. In the simplest scenarios the program runs within a virtual memory space, but is unaware of this. The built-in new() and delete() are used to get dynamic storage from the heap. These may or may not interact with the OS and MMU to allocate memory pages. More advanced scenarios might involve a custom allocator, which may use OS facilities to manage memory more directly. More about custom allocators later.
|
| Figure 1 |
Crashes
The term crash is widely used but seldom defined. In general it means some kind of serious, often low level, error that is unrecoverable [ Wikipedia2 ]. A crash is usually followed by the failed system ceasing to respond, or halting. A software application would usually have to be restarted. An embedded system might need to be power cycled. In this article it is used in a non-specific manner to mean incorrect operation leading directly to an abnormal, obvious, non-recoverable state.
MMUs and illegal access
Most systems have some kind of Memory Management Unit. It might not be called by that name, but somewhere in the system there will be a function responsible for tasks such as logical to physical address translation and controlling access. If you have an MMU it will probably signal to the application, or at least the OS, when exceptions such as illegal memory accesses occur. The definition of 'illegal' may vary, but usually includes
- any form of access to unmapped (i.e. invalid) addresses
- writing to program/protected/read only memory
- fetching instructions from non-program memory
- illegal access (application doesn't have permission)
Even if you don't have a dedicated MMU, most advanced/modern CPUs can be configured to convert illegal memory access into some sort of IRQ or CPU exception.
If you have a basic CPU it should still be possible to implement a rudimentary MMU, if you have space in an FPGA or PLD. It could be made to can raise an IRQ to the CPU, and provide a status register or two.
Details here are necessarily vague because this subject is entirely system dependent. But there is no getting away from the need to read and understand your programmer's reference manual. It is no coincidence that the list of illegal operations above is similar to the root causes of Windows GPF/BSoD [ Wikipedia3 ],[ Wikipedia4 ].
Where is everything?
When the linker takes your object files and links them into a library or executable, it can usually be commanded to output a map file . This lists symbols and their addresses. Details are specific to the tools used, but the map file or equivalent is an extremely useful tool when debugging memory problems. Given a word of memory, it is possible to deduce what it might be, by referring to the map file, and the system's memory map. The word might fall into one of a number of address ranges, and these indicate likely interpretations of the meaning of that value.
| Memory range | Possible Use |
|---|---|
|
ROM, .text, code segment, program area |
vtable, function pointer |
|
data segment, .data, .bss |
global variable |
|
task stack (*) |
automatic variable |
|
RAM, heap |
dynamically allocated memory |
Note that if your code is relocatable, a shared library, DLL etc., the addresses in the map file will not be the final addresses. In this case map file addresses will simply be offsets. The final addresses are only known once the library has been loaded.
What is stored in memory?
If we want to decipher the clues left by a memory related crash, we have to know exactly what we're looking at. Memory is just bits, bytes and words, but it is given meaning when interpreted by code. Problems, and sometimes crashes, occur when the code interprets some piece of memory incorrectly. If we can understand correct operation, then when we are faced with a crash (incorrect operation) we can look for specific symptoms that might lead us back to a root cause based on mis interpretation.
The canonical example is interpreting a number as a pointer, with null pointer the most frequent case. The code is interpreting some memory as a valid pointer, but actually it is mis interpreting a number. Whether this was meant to be a valid pointer, or is some other stray value, is moot. If the number is zero, the outcome is at least partly predictable: memory at (or offset from) address 0 will be accessed. If the number being misinterpreted is some other (essentially random) value, the outcome depends on the value in question.
Raw data
When raw data is stored in memory, aside from decoding it, we can't tell much about it. Its appearance is governed by the source code, and there are few compiler generated clues to its nature. However, if it has been allocated we can find out when, by whom, and possibly why. This may give further clues about the content. See later for more on unused/deleted blocks.
Objects and object pointers
To exist at run time, an object is either allocated its own memory from a memory pool, or it is an automatic variable on the stack. Either way, it occupies an area of memory. But what is in that memory?
Every instance of any object must include at least the non-static, data members. These will appear in memory according to platform and compiler dependent rules on data size, ordering, and endianness rules. They will often be separated by padding to satisfy the data alignment rules of either the compiler or the processor.
If there is no polymorphism, the compiler knows the type of the object at compile time. No metadata is required to identify the type and only the object's data members need be stored. When we find an object of such a class in memory, we typically see just its data members. It can be very hard to tell that the memory contains an object unless we know in advance. Often the pattern of data can be a clue but we can't assume that there will be anything definite to go on. Listing 1 shows an example of a trivial object and the resulting map and memory layout.
    class BoringThing
    {
    public:
        int a;
        int b;
        BoringThing() : a(0), b(1) {}
        void Function () { a = 10; }
    };
    void boring (void)
    {
        BoringThing *b = new BoringThing;
        b->Function();
        // resulting assembly code: note address
        // of function is absolute
        //  lwz r3,0x2C(r31) ; r3,44(r31)
        //  bl  0xA24C       ; BoringThing::Function
    }
    // Map file extract
      .gnu.linkonce.t._ZN11BoringThing8FunctionEv
         0x0000a24c    BoringThing::Function()
      .gnu.linkonce.t._ZN11BoringThingC1Ev
         0x0000a278    BoringThing::BoringThing()

    // Contents of memory at 'b' (0d5267e0):
      _address_|_0________4________8________C________
       0D5267D0| 00000000 053635F8 00000008 FDFDFDFD
       0D5267E0| 00000000 00000001 FDFDFDFD
|
| Listing 1 |
If polymorphism is involved, when the code is running and wishes to access an object, it has to find out the actual type of the object. The code therefore has to store in memory with the data members some information that identifies the object's type, initialised when the object is created. When virtual functions are called, the object is accessed and the code first reads this key to determine what type it is, and therefore exactly how to access it. Without this the code doesn't know what methods could be called, or even what data members the object might have. To meet this requirement gcc [ gcc ] and many other compilers use the address of the object's virtual function table (vtable) as this identifier, and it is stored in memory with the data members. Every class that has virtual functions has its own vtable, and conversely the vtable uniquely identifies the class. The vtable is essential for the compiler: it defines the specific overridden function to call when the code calls a virtual function on objects of that class.
The fact that the vtable pointer is stored with the object is extremely useful: given any pointer to memory, if we know that it is a (polymorphic) object, we simply find the vtable pointer, then look in the map file produced by the linker, and thereby divine the run time type of the object. If you are debugging memory problems, get familiar with your map file! It tells you most of what you need to know.
Given an unknown chunk of memory, if we spot a word that appears to be an address in program memory, that word really ought to be a pointer to a function, either global or a member of some class; or a pointer to a vtable. If we see the latter we are probably looking at an object, and can quickly confirm this by looking in the map file. Note that this relies on 'program memory' being contiguous, and being an identifiable region of memory. See the later section about controlling your memory map.
Listing 2 shows a trivial class hierarchy and a function to exercise instances of the classes. Listing 3 shows the resulting map file, Listing 4 the virtual function tables, and Listing 5 the contents of the pointers in Listing 2.
    class Thing
    {
    public:
        int a;
        int b;
        Thing (): a(0), b(0) {}
        virtual ~Thing() {}
        void Apple ();
        virtual void Banana () { a = 1; }
        virtual void Cherry () { b = 2; }
    };
    class DerivedThing : public Thing
    {
    public:
        virtual void Banana () { a = 2; }
    };
    class MoreDerivedThing : public DerivedThing
    {
    public:
        virtual void Cherry () { b = 3; }
    };
    void foo (void)
    {
        Thing * t = new Thing;
        DerivedThing * dt = new DerivedThing;
        MoreDerivedThing * mdt
           = new MoreDerivedThing;
        Thing * t1 = new Thing;
        t1->Banana();
        t1->Cherry();
        Thing * t2 = new DerivedThing;
        t2->Banana();
        t2->Cherry();
        Thing * t3 = new MoreDerivedThing;
        t3->Banana();
        t3->Cherry();
    }
|
| Listing 2 |
     .gnu.linkonce.t._ZN5Thing5AppleEv
       0x0000a470    Thing::Apple()
     .gnu.linkonce.t._ZN16MoreDerivedThingC1Ev
       0x0000a490
       MoreDerivedThing::MoreDerivedThing()
     .gnu.linkonce.t._ZN12DerivedThingC2Ev
       0x0000a4d8    DerivedThing::DerivedThing()
     .gnu.linkonce.t._ZN5ThingC2Ev
       0x0000a520    Thing::Thing()
     .gnu.linkonce.t._ZN12DerivedThingC1Ev
       0x0000a568    DerivedThing::DerivedThing()
     .gnu.linkonce.t._ZN5ThingC1Ev
       0x0000a5b0    Thing::Thing()

     .gnu.linkonce.t._ZN5Thing6BananaEv
       0x0000b28c    Thing::Banana()
     .gnu.linkonce.t._ZN5ThingD0Ev
       0x0000b2b8    Thing::~Thing()
     .gnu.linkonce.t._ZN5ThingD1Ev
       0x0000b314    Thing::~Thing()
     .gnu.linkonce.t._ZN5Thing6CherryEv
       0x0000b370    Thing::Cherry()
     .gnu.linkonce.t._ZN12DerivedThingD0Ev
       0x0000b39c    DerivedThing::~DerivedThing()
     .gnu.linkonce.t._ZN5ThingD2Ev
       0x0000b400    Thing::~Thing()
     .gnu.linkonce.t._ZN12DerivedThingD1Ev
       0x0000b45c    DerivedThing::~DerivedThing()
     .gnu.linkonce.t._ZN16MoreDerivedThing6CherryEv
       0x0000b4c0    MoreDerivedThing::Cherry()
      .gnu.linkonce.t._ZN12DerivedThing6BananaEv
       0x0000b4ec    DerivedThing::Banana()

     .gnu.linkonce.t._ZN16MoreDerivedThingD1Ev
       0x0000ba90
       MoreDerivedThing::~MoreDerivedThing()
     .gnu.linkonce.t._ZN12DerivedThingD2Ev
         0x0000baf4    DerivedThing::~DerivedThing()
     .gnu.linkonce.t._ZN16MoreDerivedThingD0Ev
       0x0000bb58
       MoreDerivedThing::~MoreDerivedThing()

     .gnu.linkonce.r._ZTV16MoreDerivedThing
       0x00391e88    vtable for MoreDerivedThing
     .gnu.linkonce.r._ZTV12DerivedThing
       0x00391ea0    vtable for DerivedThing
     .gnu.linkonce.r._ZTV5Thing
       0x00391eb8    vtable for Thing
|
| Listing 3 |
    0x00391e88    vtable for MoreDerivedThing

    _address_|__________
     00391E88| 00000000
     00391E8C| 00000000
     00391E90| 0000BA90    MoreDerivedThing::~MoreDerivedThing()
     00391E94| 0000BB58    MoreDerivedThing::~MoreDerivedThing()
     00391E98| 0000B4EC    DerivedThing::Banana()
     00391E9C| 0000B4C0    MoreDerivedThing::Cherry()


    0x00391ea0    vtable for DerivedThing

    _address_|__________
     00391EA0| 00000000
     00391EA4| 00000000
     00391EA8| 0000B45C    DerivedThing::~DerivedThing()
     00391EAC| 0000B39C    DerivedThing::~DerivedThing()
     00391EB0| 0000B4EC    DerivedThing::Banana()
     00391EB4| 0000B370    Thing::Cherry()


    0x00391eb8    vtable for Thing

    _address_|__________
     00391EB8| 00000000
     00391EBC| 00000000
     00391EC0| 0000B314    Thing::~Thing()
     00391EC4| 0000B2B8    Thing::~Thing()
     00391EC8| 0000B28C    Thing::Banana()
     00391ECC| 0000B370    Thing::Cherry()
|
| Listing 4 |
    t (0D5267E0):
    _address_|_0________4________8________C________
     0D5267D0| 00000000 053635F8 0000000C FDFDFDFD
     0D5267E0| 00391EC0 00000000 00000000 FDFDFDFD

    dt (0D5267AC):
    _address_|_0________4________8________C________
     0D5267A0| 053635F8 0000000C FDFDFDFD 00391EA8
     0D5267B0| 00000000 00000000 FDFDFDFD 31313131

    mdt (0D526778):
    _address_|_0________4________8________C________
     0D526770| 0000000C FDFDFDFD 00391E90 00000000
     0D526780| 00000000 FDFDFDFD 31313131 31313131

    t1 (0D526744):
    _address_|_0________4________8________C________
     0D526740| FDFDFDFD 00391EC0 00000001 00000002
     0D526750| FDFDFDFD 31313131 31313131 31313131

    t2 (0D526710):
    _address_|_0________4________8________C________
     0D526700| 00000000 053635F8 0000000C FDFDFDFD
     0D526710| 00391EA8 00000002 00000002 FDFDFDFD

    t3 (0D5266DC):
    _address_|_0________4________8________C________
     0D5266D0| 053635F8 0000000C FDFDFDFD 00391E90
     0D5266E0| 00000002 00000003 FDFDFDFD 31313131
|
| Listing 5 |
Note that the memory blocks shown in Listing 5 have some of the debug features described later: guard blocks ( FDFDFDFD ), inter-block filling ( 0x31 ), and the word before the start block is the block size. Each pointer points to a block that starts with the object's vtable. It is interesting to compare the type of the vtable with actual type of each pointer. Note that due to the mysterious ways of gcc 3.4.3, each vtable starts with two empty words, then two distinct (but identical) destructors. The pointer stored with each object instance is always to the first destructor, not the start of the table.
Common types of memory fault
In this section a number of familiar memory faults are introduced. One of the simplest memory faults is to leak allocated memory. This is such a widely experienced problem that it does not warrant its own section here.
Later we will discuss a number of techniques to defend against these faults, or to analyse their aftermath.
Null pointer access
Because null pointers are usually represented by the value zero, they inadvertently point to the memory at address 0. They are not meant to be dereferenced, but when they are, the code inevitably reads or writes to the memory at or near address 0.
When a piece of code dereferences a null pointer, the first thing that will happen is the compiler generated assembly code will read a word from address 0 onwards. If this in itself does not trigger an exception, the word will be interpreted.
If the pointer is to raw data, the outcome is application specific. If the pointer is to an object, the contents of memory at 0 will be assumed to be the pointer to the vtable for the object. Depending on which virtual function the code intends calling, the bogus vtable will be indexed into and the function pointer in question will be read, and then jumped to. Depending on the data, the address might be valid, data that looks like a valid address, or completely invalid. If you are lucky, the jump will be to an illegal address and the MMU will step in.
If the pointer is being used to access object data, the memory near address 0 will be read and misinterpreted.
Address 0 is the start of the zero page [ Wikipedia5 ]. The zero page has special meaning in some systems, and might not be 'normal' memory. What is at address 0 in your system? You should familiarise yourself with it, because it defines what happens when null pointers are accessed. Often its some sort of interrupt or exception table. It might be an invalid address, and the MMU will already be catching illegal access. If reading from/near address 0 does get past the MMU, what are the symptoms? If we are reading ROM (fixed data, code, etc.) we get very obscure, but completely repeatable tell-tale values. It took me a long time to understand that when I kept on seeing an exception saying that an instruction was being read from an invalid address, 0x9561FFFC , it was because of this:
      _address_|_0________4________8________C________
       00000000| 3821FFF8 91810000 9561FFFC 9541FFFC
       00000010| 9521FFFC 7D9A02A6 9581FFFC 7D9B02A6
       00000020| 9581FFFC 7D9A0AA6 9581FFFC 7D9B0AA6
       00000030| 9581FFFC 39600000 9561FFFC 7D4902A6
       00000040| 3D200002 61292EEC 7D2903A6 4E800420
       00000050| 3821FFF8 91810000 9561FFFC 9541FFFC
The seemingly random value was actually one of the words near address 0. Always check suspect values against the memory contents near address 0. See later for a way to prevent this.
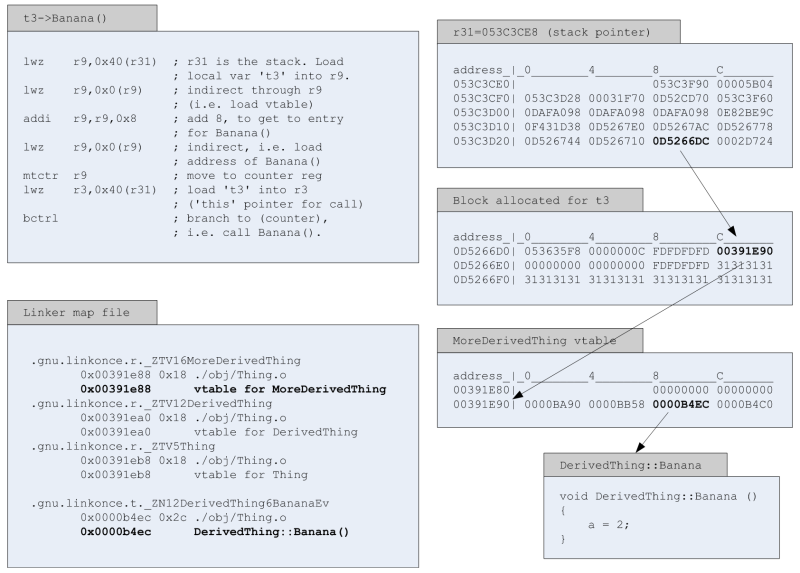
To understand the details of a null object pointer, let's look at the sequence of events during a normal virtual function call. If we consider a single line of Listing 2:
t3->Banana();
then the compiled assembly code and its interpretation are shown in Figure 2.
|
| Figure 2 |
Accessing deleted memory
Accessing deleted memory is a very grey area. It depends not only on the compiler, but on the memory allocation strategy and the dynamics of the system.
The least harmful case is that the memory has not changed since de-allocation, and is therefore effectively valid. This will pass unnoticed. In some respects a silent failure is the worst possible outcome, because we don't fail fast.
If the memory has been re-allocated it begins a new life that the original code is unaware of. If the memory is written to by the new owner, and the original code reads it, this new data will be misinterpreted. Then depending on the nature of the new data, and what the old code does with it, it might lead to a crash or less severe erroneous behaviour. It is equally disastrous if the original code writes to the memory, and the new owner then misinterprets it. Again, the worst possible outcome is that this goes unnoticed. If the side effects appear much later, the original code might have moved on from abusing the re-allocated block, and the trail will have gone cold when the problem is investigated.
In some systems de-allocated blocks, or the memory pages containing them, are given back to the OS, to be protected by the MMU. In this case access should immediately trigger an MMU exception. Here the architecture is already helping us and there is nothing to add.
Note that if the deleted memory contained a polymorphic object, the vtable pointer will have been changed to that of the base class when delete() worked its way through the hierarchy of destructors. If the memory is unaltered, using the vtable as a clue about the type of the object could be misleading.
Off the end of an array
The effect of writing off the end of an array depends on memory alignment, memory allocation strategies, the nature of the array, and the purpose of the memory surrounding the array. For example if the array is an odd number of bytes in length, and memory is allocated on word boundaries, there will be a small number of empty padding bytes after the array. Writing over these (and then reading them back) has no noticeable effect, and will be a silent failure. If we write far off the array, or it adjoins another allocated area, then other data will be overwritten. If this is accessed later, it might be misinterpreted.
Since the side effects depends on so many factors, they can be very hard to spot, and will often fail silently. We will look at ways to make if fail fast later.
Defence
Once we understand the nature of problems that stem from memory abuse, we can start to defend ourselves against them. Here are a variety of tried and tested techniques.
Tools
You should always start by attacking any problem with tools. If you are not using some form of static analysis tool as you write your code, you are leaving yourself open to the full spectrum of human fallibility. Lint will spot obvious memory leaks, null pointer use and so on, the moment you compile your code. Most systems come with some form of run time analysis tool: perfmon, UMDH (windows); valgrind (*nix).
Some of the techniques described next might replace or even interfere with mechanisms employed by COTS tools. You must investigate, understand, and experiment with your environment before committing to using them.
Block allocator
Anyone can write a block allocator, or get one off the web. A quick Google for 'memory block allocator' or 'memory pool allocator' will start you off.
When a block allocator is available, it is easy to override the global operator new() and delete() so that it is used in preference to whatever heap allocator is provided by the language support library. A further improvement is to provide dedicated allocators for, and override the allocation operators of, specific classes that are in some way interesting (frequently allocated, troublesome etc.).
Once memory allocation is under our control (rather than part of the hidden, built in, language support) we can start to instrument it, and add defensive features.
If you can build the language support library yourself, it is possible to add everything discussed here to the built in new() and delete() .
Guard blocks
The most common addition is a pair of guard words (or bookends, goalposts, etc.). When the application asks for a block of memory we allocate more than was asked for, and place a guard word at the start and end. The guard words surround the exact number of bytes asked for, not the entire block, because this may well be larger than was asked for. The pointer returned to the caller is to the memory just after the first guard (highlighted in Listing 6).
        char * x = new (10);

    For block size 18 (0x12):

    _offset__|__0__1__2__3___4__5__6__7_
    00000000 | GG GG GG GG  00 00 00 00
    00000008 | 00 00 00 00  00 00 GG GG
    00000010 | GG GG
|
| Listing 6 |
Now we can check the block for corruption: if the application writes off the end of the block (or off the front), the guard word is altered, and this can be detected. Normally the guard blocks would be checked in operator delete() , i.e. when the block is de-allocated, but this is often too late. To be more proactive, the list of currently allocated blocks can be periodically checked by a background task or on demand when certain conditions arise. The value of the guard block is not particularly important, but it would be foolish to use 00! It is worth ensuring that it can not be misconstrued as a valid address, just in case faulty code reads it as real data.
If we add a guard area at the end of our block, we can catch the most common error, off by one, without it damaging anything else.
Metadata
It is often useful to know more than just the address of an allocated memory block. If we reserve extra space in the block, we can store metadata such as:
- time of allocation (not usually very interesting in itself)
- allocating thread/task/process
- size asked for (this may be different from the size allocated if the blocks are fixed sizes)
- source file and line of code. 1
This data will normally be ignored, but when something goes wrong, post mortem analysis (whether manual or automatic) can put it to good use. It can't be added after the incident, so you must pay the price of putting it in place for every block, every time.
Fill values
A surprisingly useful trick is to fill every block with a tell tale value before giving it to the application. The fill value should be obvious, and as ever, should not look like a valid address when consecutive bytes are taken to be a pointer. Although this impacts performance, the price is usually worth paying due to the obvious benefits:
- Using uninitialised data. If the block is not filled, the previous contents, or fresh 00s, will be read, resulting in random behaviour, and possibly silent errors. The best culprit here is uninitialised pointers: if the fill value is an invalid address, as soon as the pointer is dereferenced, the MMU will step in and raise an exception.
- Unused blocks. If the fill values are still there in delete() the block was not used. Why?
- Under-used blocks. If a 'tide mark' is visible in the block, why is the application using less of the block than it asked for?
When the block is deallocated, it should be filled with a second, distinct, value. This allows access of deleted data to be caught (until the block is reallocated). Again the fill value should not look like a valid address, so that the MMU can catch illegal pointer dereferencing.
Note that the Microsoft Developer Studio C++ compiler does this in Debug mode [ MSDN1 ].
Tie down the memory map
If your environment allows you control of the linker script and/or memory map, it is possible to define your memory map in the most defensive manner possible. This ensures maximum scope for help from the MMU.
Arrange program sections with different access criteria (read, write, execute) to be grouped together, and to be on boundaries and/or page sizes that the MMU can control independently. The aim is to restrict access as far as possible, and to be as strict as you can.
Once the program has been loaded into RAM and the data section is initialised, but before main() is called; make the pages containing the program and data sections effectively ROM by restricting memory access to execute only and read only respectively.
Ensure that the zero page has no write access, regardless of its contents, so that writing to null pointers is caught. If possible, make the zero page completely inaccessible, at the MMU level, to catch all null pointer action.
The ideal system would have access rights as follows:
| r/w/x (read write execute) | |
|---|---|
|
ROM |
r |
|
.rodata |
r |
|
.text |
x |
|
.data |
r |
|
.bss |
r/w |
|
RAM |
r/w |
Fill the zero page with known illegal values
We have already seen that null pointers are intimately connected with the contents of memory at address 0, and the confusion that arises from misinterpreting it. If the context allows it, reserve the first 256 bytes or so, and fill it with with a tell-tale value which, when misinterpreted via a null pointer, is an illegal addresses. The aim is to trigger an MMU exception as soon as the pointer is dereferenced. This is what mine looks like:
       _address_|_0________4________8________C________
        00000000| BAD00000 BAD00000 BAD00000 BAD00000
        00000010| BAD00000 BAD00000 BAD00000 BAD00000
        ...
        000000E0| BAD00000 BAD00000 BAD00000 BAD00000
        000000F0| BAD00000 BAD00000 BAD00000 BAD00000
        00000100| 3821FFF8 91810000 9561FFFC 9541FFFC
        00000110| 9521FFFC 7D9A02A6 9581FFFC 7D9B02A6
Fill the zero page with pointers to a debug function
An extension to the previous technique is to fill memory after 0 with valid pointers , pointing to a debug function which raises an exception within the application. At the very least it should print "null pointer" and call exit() .
The drawback with this is that reading raw data from near zero will now read a valid address and possibly fail silently. The address of the debug function, although generated by the linker, is still a tell-tale value and should be kept in the back of the mind when investigating memory faults.
MMU exceptions should dump all pertinent registers
Most MMUs have a number of status registers which can be read when an access violation is detected. One of them will be the address which triggered the exception. All pertinent registers should be saved and made accessible to debug code, the user, etc. Armed with this data it is possible to produce very useful messages to the user. There are some examples later.
Run time checks
If you have instrumented or protected your memory blocks as described earlier, a background task can periodically analyse all blocks for integrity. This introduces the possibility of finding errors while objects are still alive, shortly after the fault occurred; rather than when they are deleted, which may be far too late, or even never.
Pool analysis
If a memory leak has evaded static analysis, it must be caught at run time. It is feasible to stop the program and analyse the heap, either by inspecting the memory directly (e.g. using a debugger), or by calling a dedicated function. Microsoft's Developer Studio IDE performs memory block analysis to detect memory leaks in Debug mode [ MSDN2 ].
Now that we know that any block of memory containing an object will probably start with a pointer to that object's vtable, one approach is to simply walk the list of allocated blocks, summing the instances of each vtable. By counting these, we are counting instances of each object type. If we are leaking objects, then over time one object count will have an obvious growth trend.
A more involved technique is to use a series of fixed size block allocators and iteratively tune the block sizes to narrow down the size of object, or piece of data, being leaked. Eventually this will lead to a short list of objects which can be debugged directly.
Analysing your memory pool usage can be very illuminating, whether in response to a problem, or simply as a background activity. The analysis can be as detailed as your imagination allows, but bear in mind any intrusion on a running system. Analysis is possible with any memory allocation strategy, although it is easier if you use an allocator that you control. If you want to analyse the built-in C or C++ heap you must first find out how it works.
Recalling the earlier section about how objects are stored in memory, a very interesting analysis is to examine the first word of every block. This gives us a picture of what is going on in our block. Below is a real (but slightly contrived) example, where FDFDFDFD is the memory block guard, AA is the allocate fill value, and DD is the delete fill value.
          Heap at 0D3B003C:
            Data      Size    Count
            -----------------------
            00391E90     C    27760	(1)
            00391EC0     C     1236	(2)
            00391EA8     C      502	(3)
            003C2FC0    1C      176	(4)
            FDFDFDFD     0       54	(5)
            42537472    14        2	(6)
            ...
            AAFDFDFD     1        1	(7)
            ...
            AAAAAAAA    20        1	(8)
            ...
            00FDFDFD     1        1	(9)
            ...
- A lot of 00391E90's. If we look back to the virtual function call example above, we'll see that this is 0x8 into the vtable for MoreDerivedThing, so we have 27760 instances of this object.
- By the same analysis, 1236 instances of Thing.
- And 502 DerivedThings.
- 176 instances of some other class, whose vtable is near 003C2FC0.
- Why are we allocating 54 arrays of size 0? Something to investigate.
- Looks like ASCII, or some other data: its certainly not an object because interpreting that word as an address results in an area of memory that is not the program (i.e. it is not within the linker .text section).
- A chunk of data, of size 1, that's been allocated but not used yet. We can see one byte of AA (allocated marker) and 3 of the 4 bytes of the trailing guard area (FDFDFD).
- The first word of a chunk of data, size 0x20, that hasn't been written to yet.
- Very probably a zero length string: 1 byte has been requested, and already set to 0, the string terminator. Worth investigating why the application is asking for 0 length strings.
Diagnostic library
This set of diagnostic tools can be gathered together into a library allowing it to be selectively linked (or dynamically loaded) with the application only when needed. This avoids the performance impact of some techniques (the block allocator in particular), but means the ability to diagnose problems is a conscious decision. With unrepeatable faults it may be too late.
Examples
This section shows a number of real world examples. They are typical failure scenarios, and all have been automatically caught by one of the techniques described here. Each example shows the output from my own MMU exception handler. All five of the CPU's exception registers are dumped just in case, but SRR0 (Save/Restore Register) and DEAR (Data Exception Address Register) are usually the only two that are directly relevant. In later examples only the important lines are shown.
Accessing deleted data
      >>> Unhandled Data Storage IRQ   <<<
      >>> current task: 'PrxS_1', time: 2010 JUN 17
       17:54:15   <<<

      SRR0  : 0010F9FC <- likely instruction which
      caused the problem
      SRR1  : 00028000
      CSRR0 : 00029EB4
      CSRR1 : 00000000
      DEAR  : DDDDDDDD <- data exception address
Here we can see that the instruction at 0010F9FC attempted to read or write data at address DDDDDDDD (our fill value for deleted memory). The data address has not been modified, so this is probably a pointer to data, not an object.
      >>> Unhandled Data Storage IRQ   <<<
       SRR0  : 002BDF08
       DEAR  : DDDDDDE1
In this variation the data address is DDDDDDDD + 4 , so we are probably looking at code that is indexing from a deleted data or object pointer. Examination of the assembly code at 002BDF08 would confirm this.
Corrupt pointer
      >>> Unhandled Data Storage IRQ   <<<
       SRR0  : 00381154
       DEAR  : 4E495077
This shows what is effectively a random data address, but one that luckily was invalid, causing an MMU exception. We would suspect a pointer that has been scribbled over by other data. We can look at the code at address 00381154 and work out which pointer, and what it was trying to do.
Null pointer read
      >>> Unhandled Data Storage IRQ   <<<
    SRR0  : 0035312C
    DEAR  : BAD00030
Here we can see that the fill value for the zero page ( BAD00000 ) has caused the null pointer to indirect to an invalid address, and 0x30 was added to the pointer before indirection.
Null pointer write
      >>> Unhandled Data Storage IRQ <<<
       SRR0 : 00018D58
       DEAR : 00000000
In this example a null pointer was written to. In fact the bug was that memcpy() had been passed a null pointer. So the tell-tale values at address 0 were never read: the code simply tried to write to address 0, triggering an MMU exception.
Corrupt function pointer
      >>> Unhandled Instruction Storage IRQ   <<<
       SRR0  : 08E12C40
       DEAR  : 0E0C0E8F
Note that the exception type is instruction, not data. This is evidence of an invalid function pointer, which was still pointing to valid memory, just not to a section of code. The instruction address that the CPU attempted to read was in an MMU page that was not marked as executable. This immediately triggered an instruction storage exception.
Bad pointer leading to an illegal instruction
      >>> Unhandled Program IRQ   <<<
       SRR0  : 00BAD000
       DEAR  : 7D35CF83
      *(SRR0): FFFFFFFF
Again, note the different exception type. This exception is triggered by an illegal instruction, in this case FFFFFFFF . The tell-tale value in SRR0 looks like it came from the zero page, but is not correctly aligned. This implies some bad pointer manipulation, possibly unchecked C style casting in the code. An invalid function pointer has been created somehow, which itself was a valid address, but pointing to program memory that did not contain valid code.
Corrupt memory block
This example shows how operator delete() can be used to check the integrity of every returned block. The diagnostic output dumps the head and tail of the block for immediate analysis. We ca n see that the block size was 0xBC , and when we look for the guard block at this offset, we find 30FDFDFD rather than FDFDFDFD . Therefore the code has written off the end of the block. Due to blocks being allocated on word boundaries, this error would not normally have been found.
      >>> AllocateError(): Delete() failed due to heap
      corruption. Allocator = Block5, param = 161B1FAC
      <<<

      161B1FA0 0DB01F4C 000000BC FDFDFDFD 47432110
      161B1FB0 0001F0B5 4C612C20 4C612C20 4C612C20
      161B1FC0 4C612C20 4C612C20 4C612C20 4C612C20
      ...
      161B2050 4C612C20 4C612C20 4C612C20 4C612C20
      161B2060 32333435 36373839 30FDFDFD DDDDDDDD
      161B2070 DDDDDDDD DDDDFDFD FDFD0000 00000000
      161B2080 00000000 00000000 00000000 00000000
It is interesting to note that the line starting at 161B2070 shows archaeological evidence of an earlier use of the block: we can see another terminating guard block that was not corrupted, and the deleted block fill value, 0xDD .
Conclusion
The overriding theme of this article is to take control of as much of your UB as your system allows. If 'U' is replaced by 'D(efined)', the 'magic stuff' under the bonnet can be tamed and turned to your advantage.
With careful preparation of your memory map you can force the run time system to tell you more about crashes than it normally would. If you can control the MMU (or equivalent), you can force access errors to be flagged rather than hidden. Subtle problems which might go unnoticed can be made to fail fast, and crashes can even diagnose themselves.
By taking control of, and instrumenting, memory allocation, you can prepare yourself for a number of failure scenarios, and provide very useful run time analysis of memory usage and leaks.
Know your enemy (memory contents) and, like a good boy scout, be prepared.
This article is a summary of personal experience: I have used nearly every technique that I describe. It is my toolbox. It is not a survey of the state of the art. If you have comments or better techniques, please get in touch, start a discussion on accu-general, or better still, write a follow-up article. n
Acknowledgements
Thanks to my colleagues (myself included) for producing a selection of interesting bugs which lead to the development of these techniques. Thanks also to Ric 'Overlord' Parkin for considerable editorial help.
References
[C++] C++ standard: ISO/IEC (2003). ISO/IEC 14882:2003(E): Programming Languages - C++
[Fowler] http://www.martinfowler.com/ieeeSoftware/failFast.pdf
[gcc] http://gcc.gnu.org/
[Henney] Kevlin Henney, ACCU general: http://lists.accu.org/mailman/private/accu-general/2010-June/021847.html
[MSDN1] http://msdn.microsoft.com/en-us/library/Aa260966 (table 1)
[MSDN2] http://msdn.microsoft.com/en-us/library/e5ewb1h3%28VS.80%29.aspx
[Wikipedia1] http://en.wikipedia.org/
[Wikipedia2] http://en.wikipedia.org/wiki/Crash_%28computing%29
[Wikipedia3] http://en.wikipedia.org/wiki/GPF
[Wikipedia4] http://en.wikipedia.org/wiki/BSoD
[Wikipedia5] http://en.wikipedia.org/wiki/Zero_page
1 This will involve turning new() into an evil macro involving __FILE__ and __LINE__